The logs branch contains the default active log DocLink creates to show the DocLink-specific Event Viewer. This section works identically to the Windows Event Viewer. For each service, the Active log will show specifics (error level, occurrence date, source, context, event id, event, and event data) and detailed properties about these events as they occur.
In the Properties section of the active log, General and Detail data about the event are given. The Actions drop down menu provides various management options for the active log.
Machine Name – on what machine the service is located.
Instance Name – on what machine the service instance is located (some services allow multiple instances to be installed.
Level – The log level refers to how verbose the logging is. See the Log Level table in the Service Monitor Dashboard section for log levels and descriptions.
Occurred On – Date on which the action occurred.
Source – The source service where the action is occurring.
Event – Indicating the level of verbosity given by the log level.
The Detail tab provides the corresponding data shown on the General tab, in XML format.
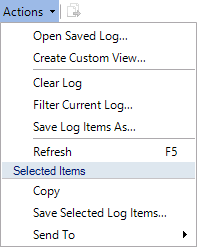
The Action drop down menu provides options to open, save, filter, customize, and clear the log, copy event details to the Windows clipboard, and e-mail items to recipients.
Service Monitor - Instances Tab
Service Monitor - Processes Tab